Bloodbath: November Rout Leaves Crypto Prices Drowning in Sea of Red


It was not just the trees that shed their red leaves this November. The autumn was doing its job in the cryptocurrency market, too.
The industry lost close to $70 billion worth of market capitalization this month, according to CoinMarketCap.com. Bitcoin, the world’s largest cryptocurrency, established an aggregated low at $3,606 after dropping from its monthly high at $6,540. That marks a 44.8% drop between the month’s peak and bottom level. Other top cryptocurrencies also didn’t fare well during the November bloodbath. XRP, for instance, noted a 40.4% drop between its topmost and lowermost levels, while Ether fell 47.5% within the same parameter.
Stellar, the fourth largest cryptocurrency, survived with 30% of its market cap and value wiped off in November. EOS, the central asset of a semi-decentralized blockchain project, also plunged 45.65% within the same time.
Bitcoin Cash Worst among Top Coins
The worst performing coin among the top crypto-assets in November was Bitcoin Cash. The BCH/USD rate tanked by 61.8% this month after a software upgrade controversy threatened its stability. Bitcoin Cash blockchain underwent a hard fork during mid-November session, leading to the birth of two competing chains: Bitcoin ABC and Bitcoin SV. To be called the original Bitcoin Cash, both the SV and ABC group waged a hash war against each other. As the war went on, it kept on taking mining resources off different PoW blockchains, mainly Bitcoin, leading to a negative investment environment for all.
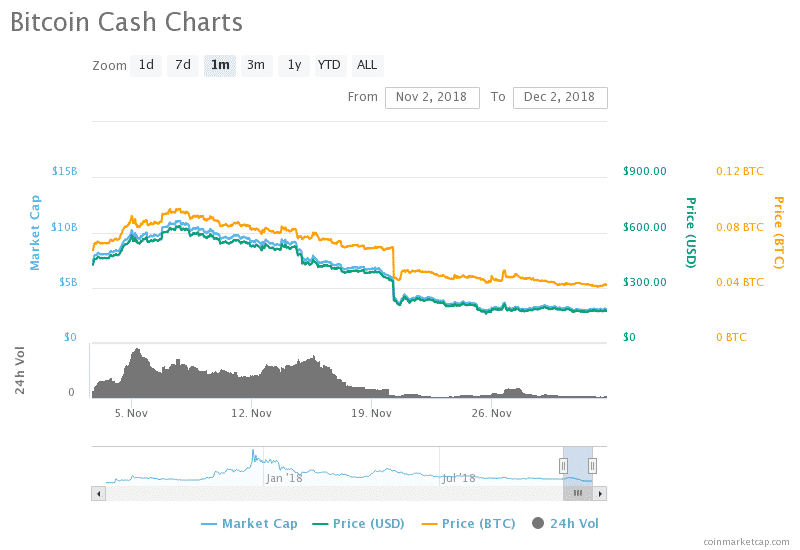
The Bitcoin SV group, at last, conceded defeat and announced to go its way as a standalone project, leaving the original BCH ticker with the Bitcoin ABC group. After the clarification, Bitcoin Cash (ABC-merged) is showing signs of bottoming out while consolidating sideways in a choppy action. The BTC/USD is trading at 173-fiat, up 11.5% from its yearly low at 155-fiat.
Bitcoin SV Enters Top 10
Two weeks after the split, Bitcoin SV launched itself a separate coin with a promise of becoming a better blockchain than others. The first week of trading saw BSV/USD establishing itself in the top ten coin index, with its market cap peaking through $2.1 billion at one point. It is now ranked 9 according to total market capitalization.
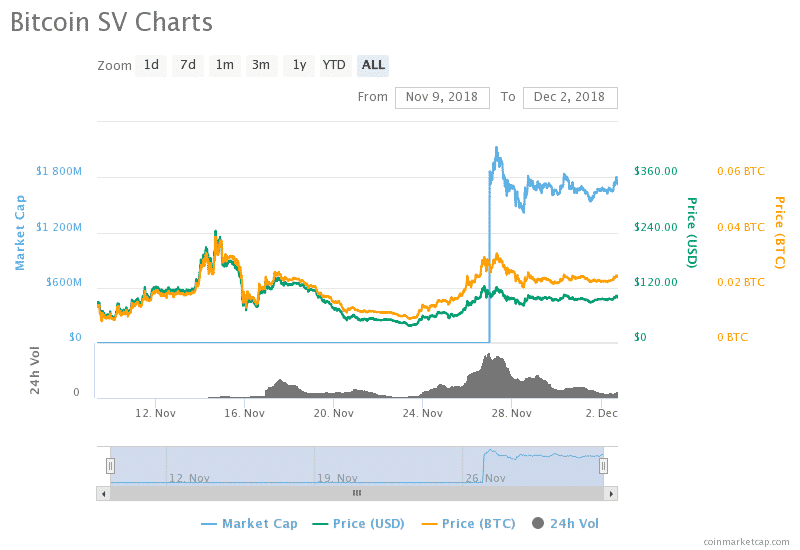
The BSV/USD is currently trading at just shy of 100-fiat, managing support at 89.31-fiat. Fundamentally, the coin expects to extend its upside momentum.
Factom Best Performer
As the rest of the market bled, Factom recorded its best month in years after rising more than 130% in November. Its market capitalization was close to $37 million at the beginning of this month but surged to as high as $113.23 million in the end.
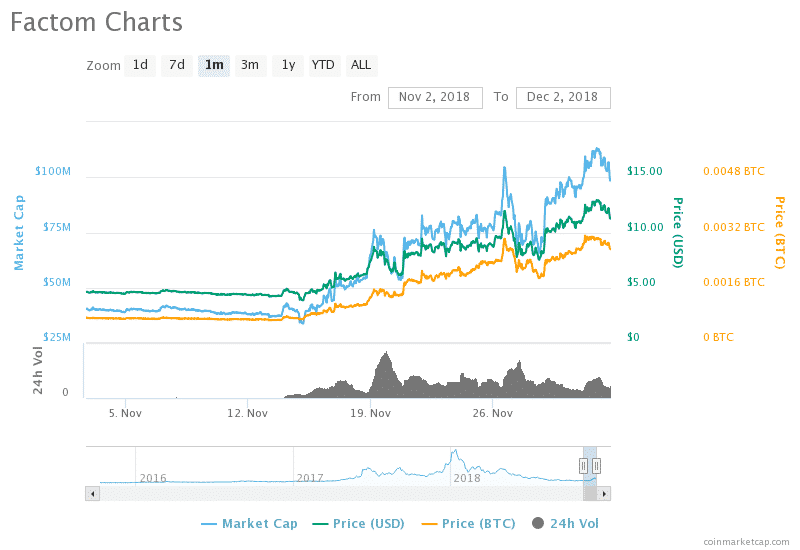
Factom didn’t have any strong technical factors behind the surge. As a project, it, however, registered some positive developments, beginning with Equator. The mortgage software and marketing firm partnered with Factom to use their Harmony blockchain as a service [BaaS] platform. In another event, Japanese exchange CoinCheck announced that it would add FCT tokens to its trading platform.
The Future
The entire cryptocurrency market is now in a process of establishing a bottom. That said, to say that the bear run has finished would be incorrect. It is now unclear if the market is consolidating before the next breakdown, or is organically rebounding.
The global market cap can fall further if bitcoin fails to sustain $3,500 as support. Nevertheless, the digital currency expects a positive round of developments next year, with more room being created for institutional investors on service and regulatory front. Breaking below $3,500 would put the downside risk towards $2,500. Traders are recommended to avoid going long on certain technical hints, such as strong reversals, or a Doji formation on weekly charts.
Click here for a real-time bitcoin price chart.
Featured Image from Shutterstock. Charts from TradingView .
