Bitcoin Volatility Indicator Suggests It’s Time You Sell Your Crypto

This indicator is flashing sell for bitcoin. | Source: Shutterstock
By CCN.com: Bitcoin is pulling back sharply as investors and traders alike look to consolidate cryptocurrency gains in 2019. One indicator, however, suggests that the selling pressure isn’t over yet.
The VERA Convergence-Divergence signal is a Bitcoin volatility indicator that’s flashing warning signs.
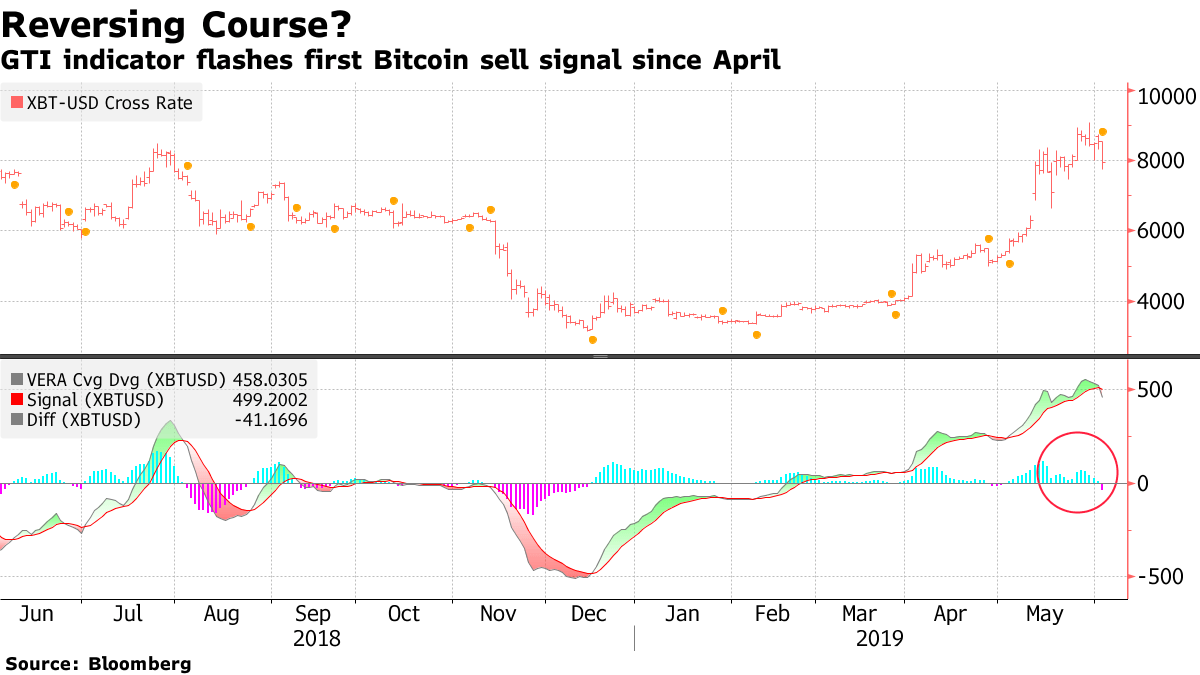
As Bloomberg reports , the ‘VERA Cvg Dvg’ is once again flashing a sell in 2019. The first and only other sell signal this year was a red herring in late April. If traders had taken the bait then, they would have lost out on a potential 70 percent gain.
A Reliable Bitcoin Volatility Indicator?
Traders are coming to grips with wild market price swings and parabolic moves that’s become water cooler talk in crypto. The tools to deal with these swings are naturally also following suit.
VERA stands for Volatility Explosion Relatively Adjusted. Add Convergence Divergence to that definition and you have a mouthful of jargon that sounds like some sort of advanced sci-fi weapon. An apt description for Bitcoin perhaps, given how it could be viewed as a new financial weapon striking fear in the heart of the establishment.
The VERA Dvg Cvg is designed to deal with massive price movements. And while the company behind the indicator, GTI doesn’t specifically mention Bitcoin as its primary use-case, it’s not that hard to make the connection.
“Lately, abrupt market changes, such as gaps and high volatility, are more frequent. Technological developments accelerate and, in some cases, have magnified reactions to unpredictable events. This tool will improve the management of investment strategies.”
It’s Not All One-Way Traffic up This Bitcoin Street
Bitcoin is roughly down 18 percent since its late May highs and traders would do well to get some perspective. Nothing goes up in a straight line. And if it does, it’s most likely to fall right back down on your head. From trough to peak, Bitcoin is still up almost 200 percent since December 2018. That’s delicious by just about any measure.

In fact, as Charlie Bilello (Director of Research at Pension Partners) points out, Bitcoin was the best performing asset in May. In other words, the new mantra should be “buy Bitcoin in May and say hooray”.
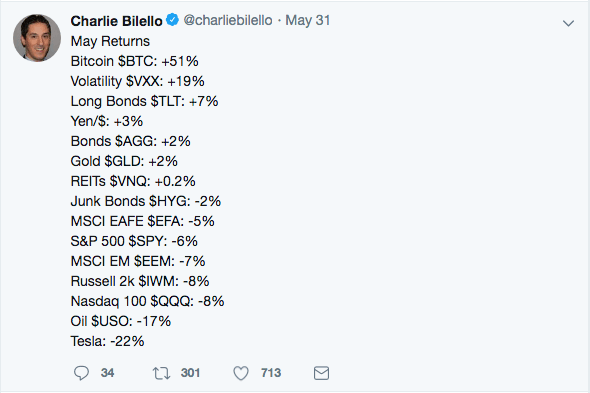
The next best-performing asset was volatility itself. The VXX is a short-term volatility instrument that has gained popularity in recent years along with traditional investors thirst for yield. They’ve consequently piled on the risk trade as growth continues to stagnate in the US and Europe.
Blink and You May Miss the Boat
Buy and sell indicators are a dime a dozen. Any indicator that perfectly predicts tops and bottoms would quickly lose it’s effectiveness once traders flock to a new holy grail of finance. Obviously, there needs to be a buyer for every seller.
Is it time to sell your Bitcoin? Possibly as a gifted trader otherwise the claim is dubious at best. Some of Bitcoin’s biggest price moves come in the shortest time-frame when no one’s looking. If this contributor ever found the perfect Bitcoin volatility indicator, he sure wouldn’t share it with you.
This is not trading advice. Click here for a real-time bitcoin price chart.
