Bitcoin Struggling at Resistance

Bitcoin has encountered fierce resistance at the 4th arc for the past 2 days. (A reminder that my charts are taken off the Kraken exchange. Other exchanges have charts that are a bit different.)
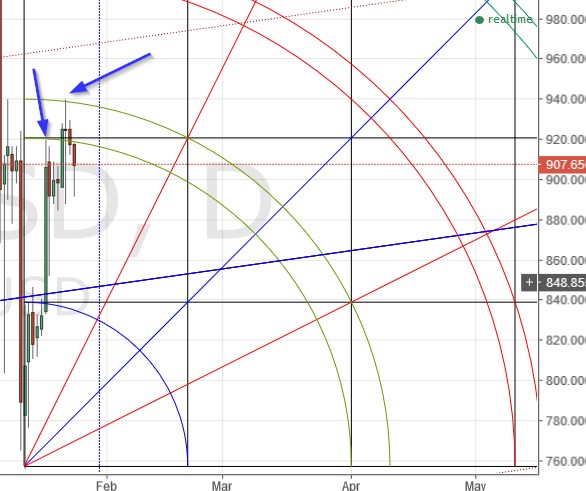
Let’s start with a look at the daily chart:
Since the last time I wrote, price was able to overcome the 1st arc of the pair. It was then stopped by the 2nd of the pair, rather mercilessly. I remained a bit optimistic about the immediate future, until I saw that price closed below the arc pair a few hours ago. This is hardly bullish and suggests that prices will likely be flat to lower for the immediate future.
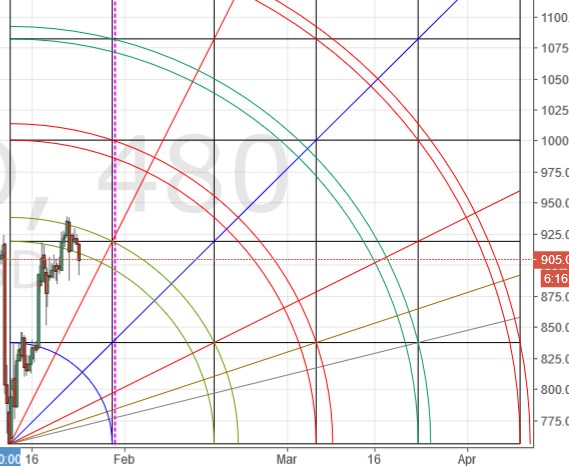
The 8-hour chart yields a similar picture, with a bit more detail:
There is a tiny bit of good news for bulls on this chart however. At the swing high, price closed ever-so-slightly above the 2nd arc of the pair. This suggests that the 2nd arc is vulnerable. However, there is no guarantee that it will surrender anytime soon.
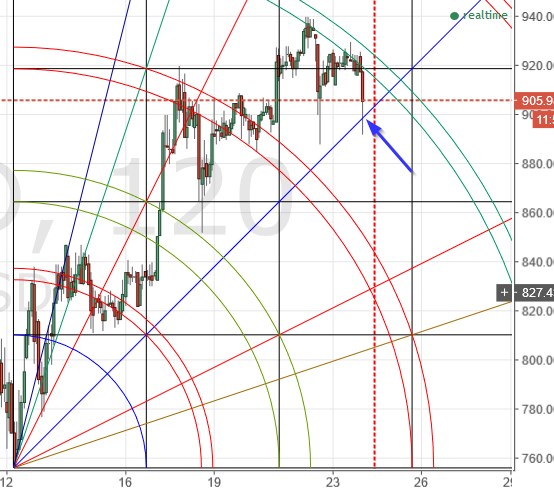
Finally, let’s look at a 2 hour chart for more detail still:
Here, as you can see, the 4th arc has been insurmountable ever since it was encountered by pricetime 2 days ago. I am a bit concerned by the fact that price (briefly punctured the 1×1 angle (blue line) recently. If we see a close below that angle, this will be quite bearish.
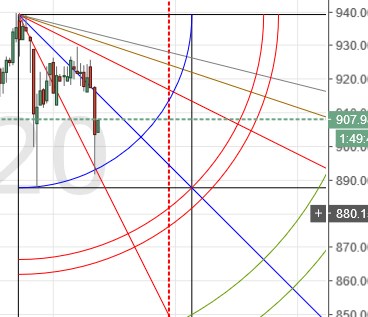
To get a look at the bearish argument, let’s look at a bear setup on the 2hr chart:
Here we see that the low of the last candle just passed the 1st arc and the 2×1 angle, and found support there – at least temporarily.
This is not, imho, a time to open any new positions, either long or short. If one is already holding a position either way, it might sense to keep it open just a bit longer to see which happens first – a close below the 1st arc (quite bearish) or a close above the 1×1 angle (bullish).
Happy trading!
Remember: The author is a trader who is subject to all manner of error in judgement. Do your own research, and be prepared to take full responsibility for your own trades.
Image from Shutterstock.