
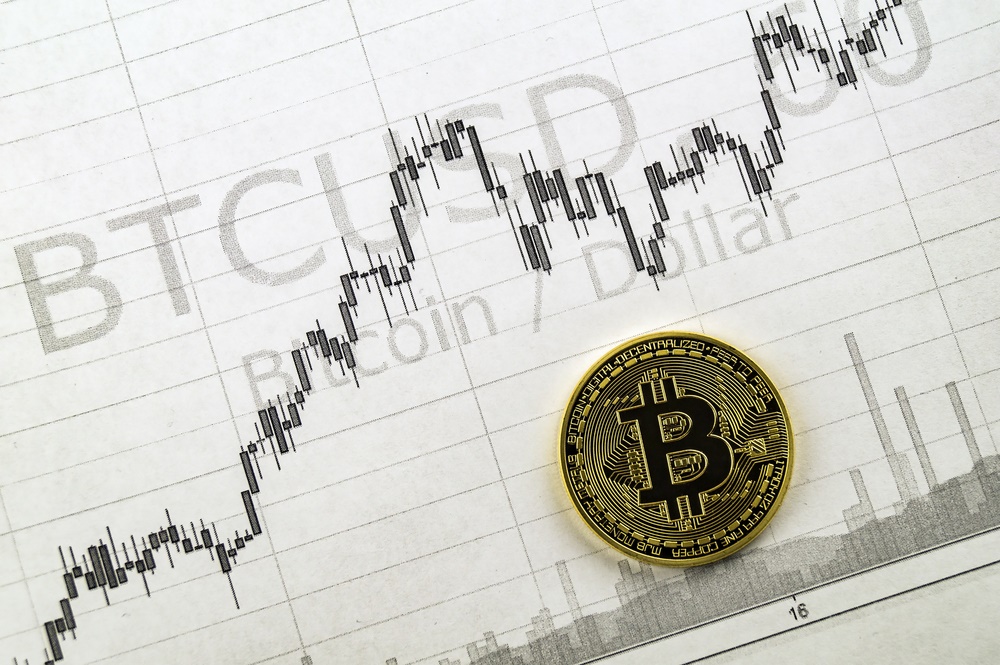
Following up on the weekend look at Bitcoin’s long term price chart, we will look again today at the long term (8 day candle) chart of BTC, per Kraken.
Over the weekend we looked at a Bull Setup. As we saw, that setup suggests a bull move that will likely last several more months. But of course, it goes without saying that there are both bulls and bears in the market at pretty much any given moment. I expect that is well understood by everyone reading this article. So, it is not enough to just look at a bull setup as we did in my last article. We want to gauge bear strength also.
So let’s look next at a bear setup that looks at the bear forces operating in the market. Will it paint the same or similar picture as the bull setup?

As you can see, the bear market of 2014 was almost glued to the all-important 1×1 Gann angle (45 degrees) for 6 full months before it finally broke free of the angle in January 2015. Price started rising as soon as pricetime cleared the 2nd arc pair. But this not very bullish, because it started climbing below the arc pair rather than above it. This suggests that the 2nd arc pair represented resistance rather than support. So, it is not terribly surprising that price was later stopped by the 5×1 Gann angle.
You will note that price bounced precisely on the 3rd arc pair, BUT THE BOUNCE WAS QUITE WEAK. The best that can be said about the bounce is that it was able to close above the 4×1 Gann angle, and stay there.
We are now seeing sideways movement through the 3rd arc pair. This is not surprising. Markets often move sideways when traversing through an arc pair. But overall, this is not a terribly bullish chart.
You will note that the chart is now exactly at the end of the 3rd square. This is a moment in time when reversals or accelerations often occur. This candle will not be replaced for another 6 days. I am very curious to see what direction this candle takes. If it accelerates to the upside, I will watch to see if the 5×1 angle is taken out. (Price would have to rise to ~ $714 to get there.) If we see a rally in the next few days/weeks, $714 would be a great place to take profits! On the other hand, if price turns down on this candle, I will close any long positions.
In our next article we will look further at this long term chart. There is still more information here. Happy trading!
Remember: The author is a trader who is subject to all manner of error in judgement. Do your own research, and be prepared to take full responsibility for your own trades.
