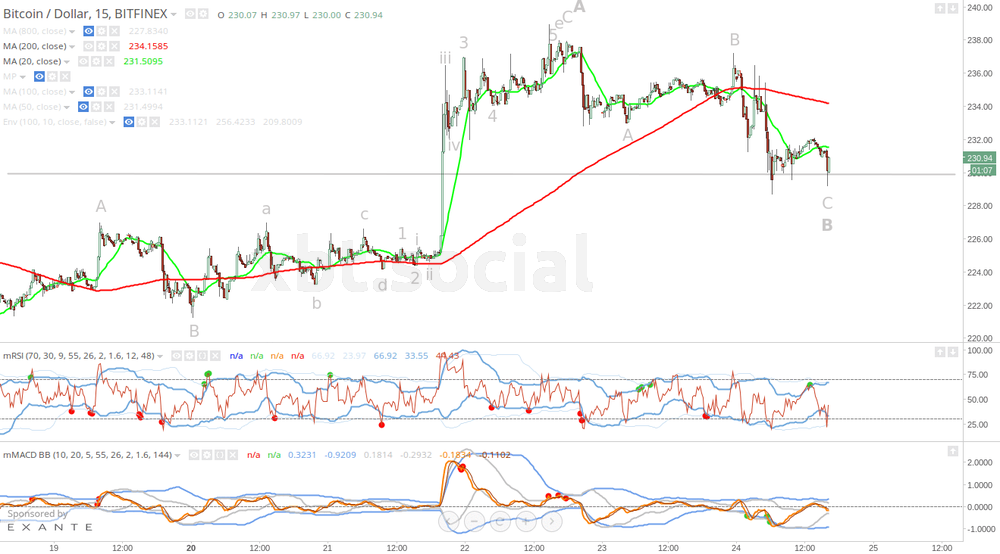
Bitcoin price is engaged in base-building for the next wave of advance. The marke traded price down to our target at $230 in a corrective ABC wave from Wednesday’s high. The next wave up should see price targeting $250 and higher.
This analysis is provided by xbt.social with a 3 hour delay. Read the full analysis here . Not a member? Join now and receive a $29 discount using the code CCN29.
Bitcoin Price Analysis
Time of analysis: 13h47 UTC
Bitfinex 15-Minute Chart

Also Read:Why The Preference For BTC-China Charts In Analysis?
RelatedNews
From the analysis pages of xbt.social, earlier today:
A very close-up look in the 5-minute BTC-China chart [only shown at xbt.social] shows the various indicators as they lead up to the surge higher. We are trading the move in the 15-minute chart, but nothing stops the trader from watching the faster 5-minute chart for clues and an early signal. Just be sure you don’t trade a signal in the 5-minute chart without referencing the 15-minute chart – the 5-minute chart gives plenty of signals for insignificant subwaves.
Our Trade Recommendation has the purpose of trading a similar consolidation and surge higher. If anything else happens in the chart, then we are unlikely to see the TR entry conditions fulfilled, and no position is opened.
The Bitfinex 15-minute chart, above, shows that the last wave down had twice tested support around $230 (dashed grey horizontal line). The wave may still complete with additional lows to support, or may start building a base, smaller than the structure in the left of the chart, from the current area of price action.
The market is keen on advance, and there are likely to be waves that spike to the upside. The market is likely to wind sideways until MACD has fully compressed.
Be on standby to open the position but do not be too eager to initiate your trade. It may take several hours for the surge up to begin.
There is an outside chance – as always in unpredictable markets – that price does not fulfil our expectations and does something else, so stick to the conditions outlined in the Trade Recommendation.
An xbt.social member makes a good point with one line drawn on the chart:
Join CoinCompetition and win 5 bitcoins. Start: May 1st.
Summary
Bitcoin price is in the process of recovering the chart area toward $300. Having failed to make a lower low, it is likely that the move up will, similarly, print a smaller price wave. We have $270 as a primary target for the current advance, which should surge higher over the weekend.
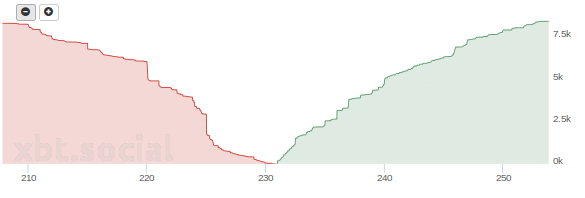
Bitfinex Depth chart: Who knows what goes through the minds of the guys and gals who work this orderbook all day long?

Click here for the CCN interactive price chart.
What do readers think? Please comment below.
This analysis is provided by xbt.social with a 3 hour delay. Read the full analysis here . Not a member? Join now and receive a $29 discount using the code CCN29.
Readers can follow Bitcoin price analysis updates every day on CCN.
Disclaimer
The writer trades Bitcoin. Trade and Investment is risky. CCN accepts no liability for losses incurred as a result of anything written in this Bitcoin price analysis report.
Bitcoin price charts from TradingView.
Images from Shutterstock.