Bitcoin Price Due for a Modest Bounce

 What a difference a day makes, or so they say. Today’s market fall was completely expected. We discussed the reasons in detail in yesterday’s article. No need to rehash it today. But where do we go from here? Where and when is the bottom? Fake news from China is only excuse for the market to move.
The only this we can say with certainty about the bottom of this market is we are 24 hours and $30 closer to the end than we were yesterday. But, of course, that is unsatisfying to say the least. So let’s indulge in a bit of speculation.
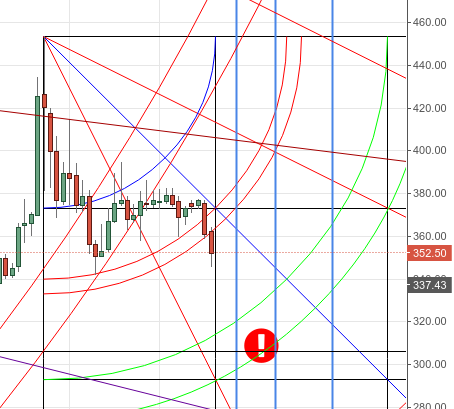
60-minute Chart

The 60-minute chart us the market found temporary support at a Gann 2×1 line, and is approaching the 5th arc. While there is no guarantee that hitting the 5th arc will mark the end of the bear market, it is likely we will see a bounce when/if we get there.
So when will we get there, and at what price?
On this short term chart, I see two energetic times in proximity. The times are 20 and 22 hours from this writing. That would be a reasonable time to think we might hit the 5th arc. If we hit the 5th arc in 20 hours time (blue star), we will hit it at ~ $318. The top of the square is another target (red star). It is sitting at $336.
Daily Chart
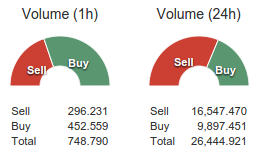
The daily chart may be more meaningful from a long term perspective. This setup shows an interesting convergence of three items. The top of a square of a longer term setup, a 2nd arc from the current setup, and an energetic time. They meet at the same place in price-time in ~ 4 days, at a price of ~$315-320. I find this convergence quite interesting and will be watching it closely. I think you might want to do the same. Todays seller ratio shows we have more buyers than sellers.
Happy Trading all!
Images from Shutterstock.
