Bitcoin price teetered on the edge of moving average support near $250 before finally rolling over the edge during the cross-over US/Asia-Pacific hours. Exchange charts show that price had sold off to their support floors near $220 and 1400 CNY before stabilizing near $230 and 1500 CNY. Bitfinex saw the January 2015 low of $160 on a downward spike.
This analysis is provided by xbt.social with a 3 hour delay. Read the full analysis here . Not a member? Join now and receive a $29 discount using the code CCN29.
Bitcoin Price Analysis
Time of analysis: 05h11 UTC
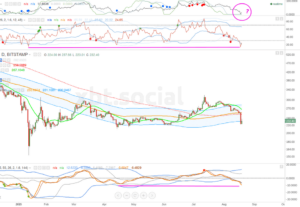
Bitstamp 1-Day Chart

From the analysis pages of xbt.social, earlier today:
RelatedNews
Bitcoin price slowly approached the 1-day chart moving averages, as if to conclude the downdraft, and then plummeted to the support floor.
Price is currently trading around our secondary target of $230 (Bitstamp) and 1500 CNY (BTC-China). Although the chart technicals indicated this possibility it still comes as a surprise.
Our short trade remains open.
Price is currently trying to push back above the 1-day 100MA’s 10% envelope in what looks like corrective price action in the 15- and 5-minute charts. The daily chart, above, is heavily reverse diverged to the downside, but still shows no final divergence in the stochastics (top). Although not guaranteed, price may make another lower low.
Equally, a scenario exists whereby price may continue decline below $200. It cannot be ruled out – a survey of the social media shows that not only the Bitcoin ecosystem, but wider society is in conflict. Market behavior reflects this psychology: commodities have been declining for months, mainstream media delusionally babbles about the next stock bet, and all of this accompanied by fissures in the global economy. Sometimes, when you kick a can down the road Bad Things can happen.
Analysis Update
Time of analysis: 15h00 UTC
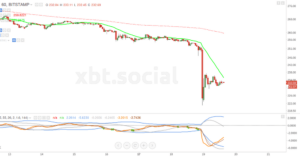
Bitstamp 1-Hour Chart

Since the completion of today’s drop, price has been tracing out a corrective price pattern. A clue to the destination of the correction can be found in the MACD indicator in the above chart.
It is usual (although not obligatory) for MACD to return to its zero line following a strong bitcoin price move. In this case MACD is pushing higher – despite price zigzagging downwards – and the orange MACD line is above its black signal line. The curvature and ascent of MACD implies that it is on route to the horizontal zero line. This should start in the 5-Minute chart, then happen in the 15-Minute chart, and upward through timeframes – depending on the size and strength of the move,
Once MACD nears zero it will have formed a reverse divergence since it will register a higher high in relation to the drop zone of yesterday’s decline, while price usually only reaches a third (or half) of the distance.
At this point both MACD and RSI indicators would be reverse diverged to price and force a move lower – either to a new low or to a new corrective low. Once we see the outcome of the above sequence of events we will have more price action from which to extrapolate the next move: continuing decline or the start of advance.
Should advance begin from the current position in the chart, it should haul good distance to the upside. The coming days are critical for the outlook of continuing advance.
I’m always thinking about losing money as opposed to making money. Don’t focus on making money, focus on protecting what you have. – Paul Tudor Jones
Summary
The bitcoin market remains in flux as other global markets exhibit volatile price declines. The Shanghai Composite Index, for example, dropped 5% since its open and the S&P500 has been edging lower for days. The strategy, now, is not so much to try to call a bottom and search out the next profitable trade but, rather, to adopt a defensive stance and wait for clear signals in the chart.
Bitfinex orderbook depth and Buy/Sell Volume:

Click here for the CCN.LA interactive bitcoin price chart.
What do readers think? Please comment below.
This analysis is provided by xbt.social with a 3 hour delay. Read the full analysis here . Not a member? Join now and receive a $29 discount using the code CCN29.
Readers can follow Bitcoin price analysis updates every day on CCN.LA. A Global Economic Outlook report is published every Monday.
Disclaimer
The writer trades Bitcoin. Trade and Investment is risky. CCN.LA accepts no liability for losses incurred as a result of anything written in this Bitcoin price analysis report.
Bitcoin price charts from TradingView.
Image from Shutterstock.
