Bitcoin Price Breaks at a Telling Moment

Well, it came to pass that there was a serious correction the moment bitcoin price got past the 2nd arc pair, as we discussed yesterday. I hope traders pulled their stops in tight as was also discussed. Here is that chart again. Note that the break occurred as soon as the 2nd arc pair could no longer offer support:
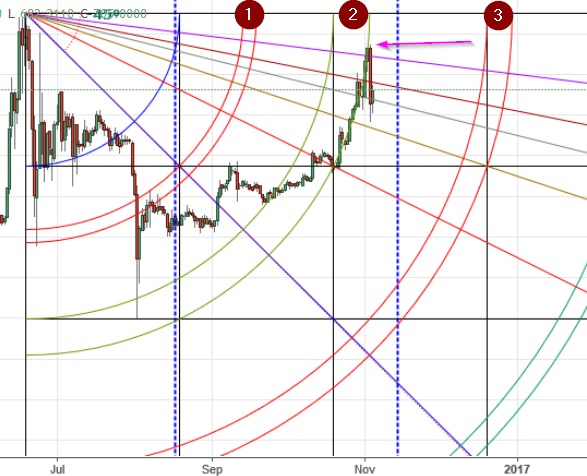 So what does this tell us? Well, for starters it tells us that we can not ignore this bear setup. The long-term bull case is pretty persuasive, as we have discussed in recent days. But this recent break is pretty undeniable evidence that the market is working itself out according to this bear setup also. The bears are not dead yet.
I found another piece of evidence today that made me re-think some of my short-term bullishness as well. I looked at the ETHXBT chart and saw something I wasn’t expecting to see. It seems that the chart has found strong support on a 5th arc. Take a look:
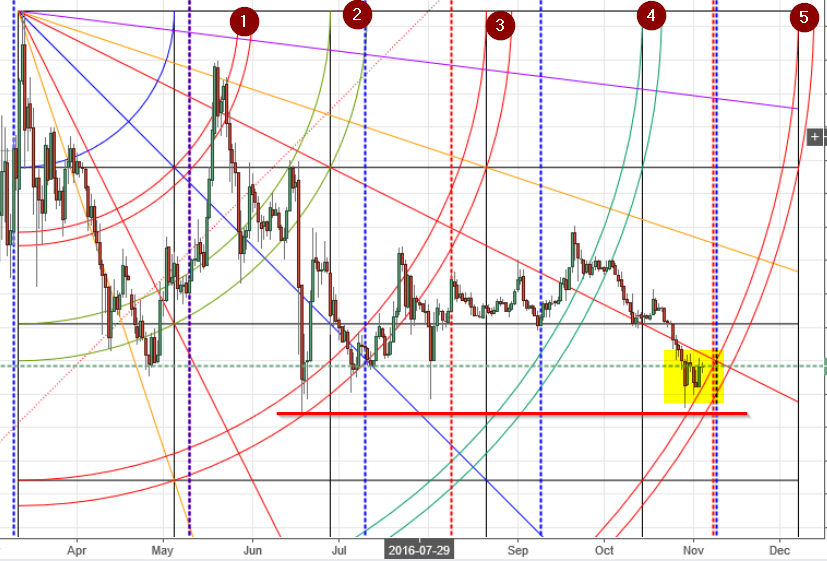 Now, we all know that Support and Resistance often breaks. So it is certainly possible that the 5th arc will break and this chart will resume its fall. But having said that, 5th arcs are typically very strong. We can see that the arc has withstood two challenges in the past few days. What does this mean?
It means there is a good chance that eth will gain value RELATIVE TO XBT from here. That could be because A) eth strengthens here, B) xbt weakens here, or C) Both.
Given the recent break of XBT as soon as it left the 2nd arc pair as discussed above, coupled with this ethxbt chart, I have closed my long position in XBT (more precisely I was stopped out and did not re-enter), and am looking for a reason to reverse to short. If we see a close on this ethxbt chart above the (red) 2×1 Gann angle directly overhead, I will probably do just that.
Happy trading!
Remember: The author is a trader who is subject to all manner of error in judgement. Do your own research, and be prepared to take full responsibility for your own trades.
