66 Rate Cuts Fuel Dangerous Bond Market Bubble in 2019; When Will It Pop?

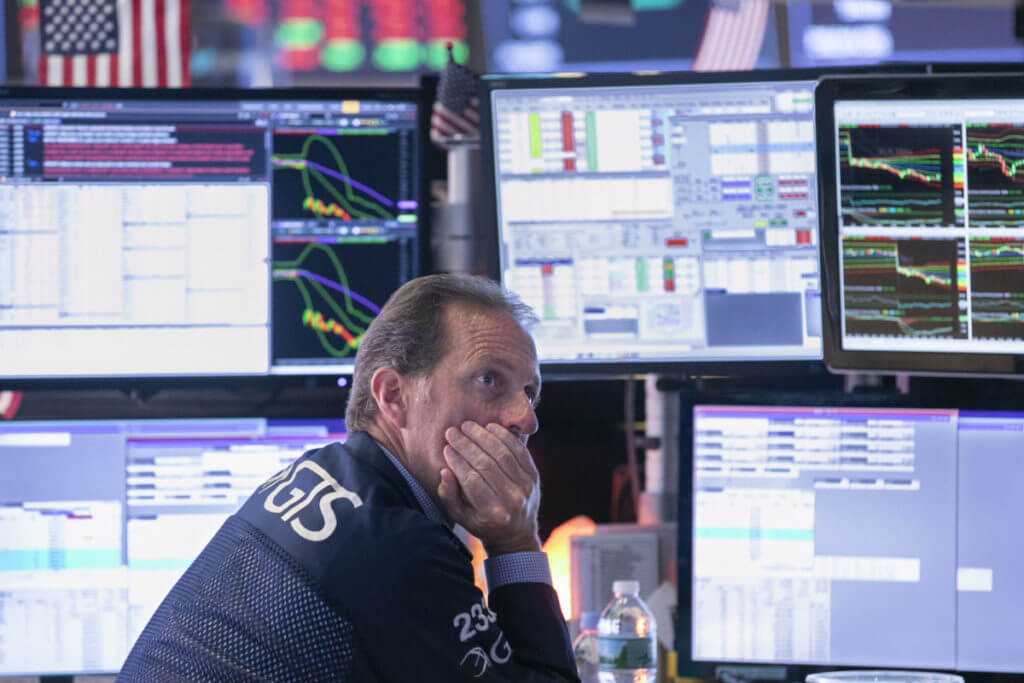
2019 was a record year for bonds. It's not clear whether that's a good thing or a bad thing. | Image: AP Photo/Richard Drew, File
- 2019 was a stellar year for fixed-income funds, as government debt became the go-to asset for anxious investors.
- Central banks around the world cut interest rates 66 times this year, creating a sense of urgency to buy bonds before rates decline even further.
- At least three traditional measures of market bubbles indicate bonds fall into this dangerous category.
2019 was a record-breaking year for fixed-income funds, as investors poured money into the bond market before interest rates came down even further. The upsurge in demand has sent bond yields tumbling, and even triggered the most ominous ‘recession warning’ since the financial crisis.
The bond market bonanza ran parallel with a surging stock market, as central-bank liquidity continued to fuel both asset classes. No longer afraid of inflation, policymakers are keen to loosen constraints even further to keep the expansion running.
Record Inflows for Bonds
Inflows into all kinds of fixed-income funds have been positive for 49 straight weeks, marking the longest expansion since 2001, according to EPER Global data that was reported by the Financial Times . Over that stretch, investors poured $468 billion into fixed-income funds, far eclipsing the previous high set in December 2012.
Bond funds collectively hold $5.8 trillion in assets, up from $4.9 trillion at the start of the year. The difference (roughly $800 billion) reflects net inflows and rising prices.
Municipal bond funds have been standout performers thanks to higher state and local government revenue, tax reform and improved credit ratings. The SPDR Nuveen S&P High Yield Municipal Bond ETF has returned almost 10% this year and is fast-approaching record highs again.

Central Banks Capitulate
The record inflow into bonds has been fueled in part by massive central-bank intervention – the kind that followed the 2008 financial crisis. Central bankers have slashed interest rates a total of 66 times this year, according to JPMorgan.
The Federal Reserve is the most famous example of capitulation: The Federal Open Market Committee (FOMC) cut interest rates three times between July and October. Those rate cuts were accompanied by a hefty dose of emergency repo operations that will continue indefinitely. In other words, the U.S. financial system is in a state of disrepair but the Fed won’t tell us which of the major banks is on the brink of insolvency.
Investors are snatching up bond funds in part because they’re convinced interest rates are heading lower. Although the Fed insists rate cuts will be paused for now, all it takes is a few dismal data releases to change expectations.
The Fed is facing pressure from President Trump, but others like the Reserve Bank of Australia are being urged to adopt quantitative easing . Even Australia, a nation that has dodged recession for nearly three decades, is on the precipice of a major economic downturn.
Where are Bond Markets Headed?
Forecasting the path of government bonds has become notoriously difficult in today’s climate. Just ask the panel of economists polled by The Wall Street Journal . They were asked where they thought the 10-year Treasury yield will end up 12 months from now. Opinions varied from just over 1% to as high as around 3%.
The rush into government bonds this year triggered one of the most ominous recession warnings since the financial crisis – namely, the inverted yield curve. But many of the fear-inducing issues that caused the yield curve to invert have faded – at the surface, at least.
The United States and China have apparently finalized phase one of their trade agreement, the United Kingdom is on a clear path to Brexit and recent economic indicators suggest the U.S. economy will avoid a major downturn at the end of 2019 . These recent developments caused the Dow Jones and broader U.S. stock market to hit fresh all-time highs.
Of course, everything isn’t as rosy at it appears. The U.S. and China have been down this road before, and without proper enforcement action, ‘phase one’ of the trade deal is nothing more than a photo op. Boris Johnson will probably “do” Brexit, but the forthcoming transition period will create uncertainty for Europe’s second-largest economy. And while the U.S. economy is keeping recession at bay, it’s expansion is running below trend at just 2% annually.
Either way you look at it, bond markets meet at least three of four technical definitions of a bubble, according to Chris Watling, a strategist at Longview Economics.
The four hallmark characteristics of a bubble include the influx of cheap money, higher levels of margin trading, overvalued asset prices and a narrative that explains the runaway price growth. Reasons one, three and four are certainly met, according to MarketWatch editor Steve Goldstein . Reason two – margin trading – requires more research.
U.S. Treasury Yields Rise
The yield on the benchmark 10-year Treasury note rose 7 basis points on Friday to 1.89%, the highest since the first week of December. The yield on 30-year Treasury bond rose almost 7 basis points to 2.32%.

Treasury yields have seen a swift recovery since the summer when they hovered near record lows. Compared annually, yields have declined sharply.