3 Reasons Why Bitcoin Price Could Nosedive Below $7,500


Bitcoin price is seeing a major correction this week and could sink further. | Source: Shutterstock
Bitcoin has suffered a significant setback after dropping in rates by approximately $2000 in the last 48 hours.
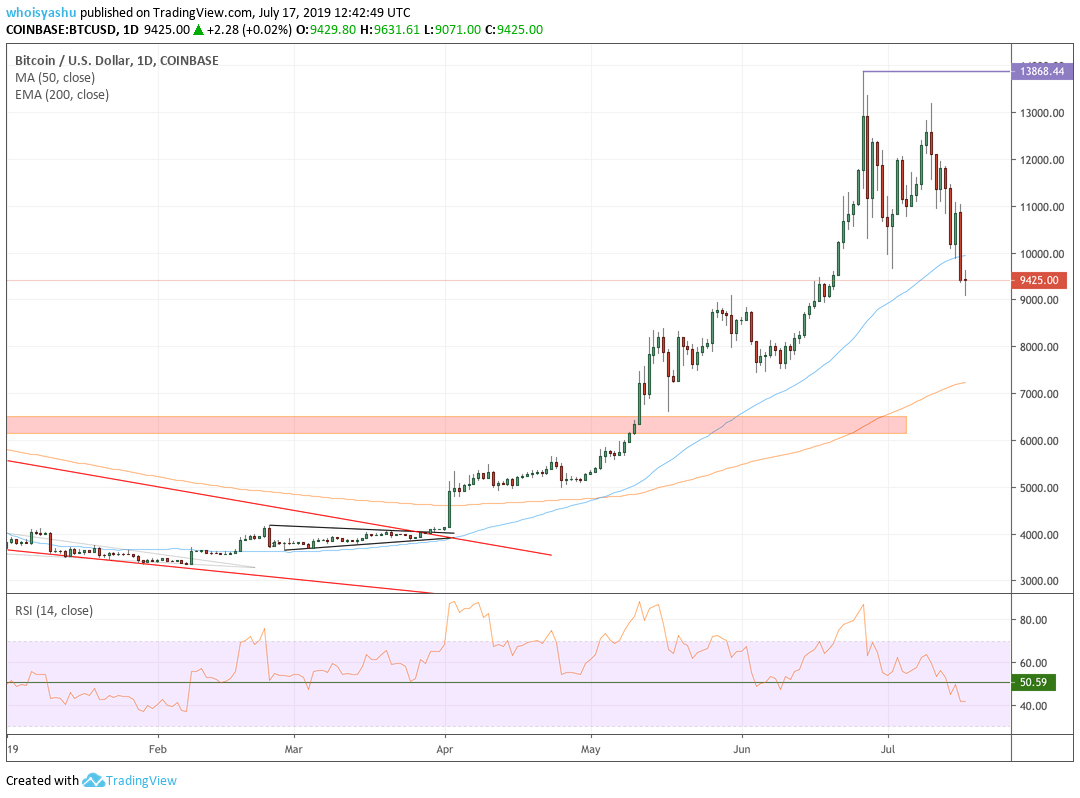
The bitcoin-to-dollar exchange rate on Wednesday established a fresh lower low of $9,071, down 3.8 percent from the market open. The move downhill erased almost a quarter of bitcoin’s value in the last seven days, marking an end to a prolonged upside action that started during the first quarter of 2019.
The latest move the downside appeared after the head of Facebook’s Calibra Project, David Marcus, appeared before the Senate Banking Committee on Tuesday. The executive heard and responded to a string of queries put forward by the US lawmakers. The hearing saw Marcus receiving a verbal bashing for being “delusional.” One senator even accused Facebook of running a bull**** financial propaganda.
On the technical front, however, bitcoin was undergoing a robust corrective move even before the Senate hearing. The latest price action indicates that the cryptocurrency is merely neutralizing its overbought bias. It is now looking for a stronger support area to initiate a new pullback action. And, based on specific technical indicators, it is likely for bitcoin to fall below $7,500 before the next bounce back.
#1 Filling the Bitcoin Futures Gap
According to CME Futures data, bears are looking to fill the gaps left by the Bitcoin Futures market. Traders have also already closed a Gap, as represented by a rectangle in the chart above. And now, they are moving towards the next two gaps: the first one is at the $8,505 level, and the other is at $7,305.
The probability of a stronger downtrend is high mostly because the latest fall accompanied a rise in selling volume. Ideally, that is considered breaking out of the consolidation channel. Moreover, the bitcoin price is starting to form lower highs and lower lows as viewed from the year-to-date high of $13,868.44, confirming that traders would want to test both the $8,505 and $7,305 levels soon.
$2 Fibonacci Retracement
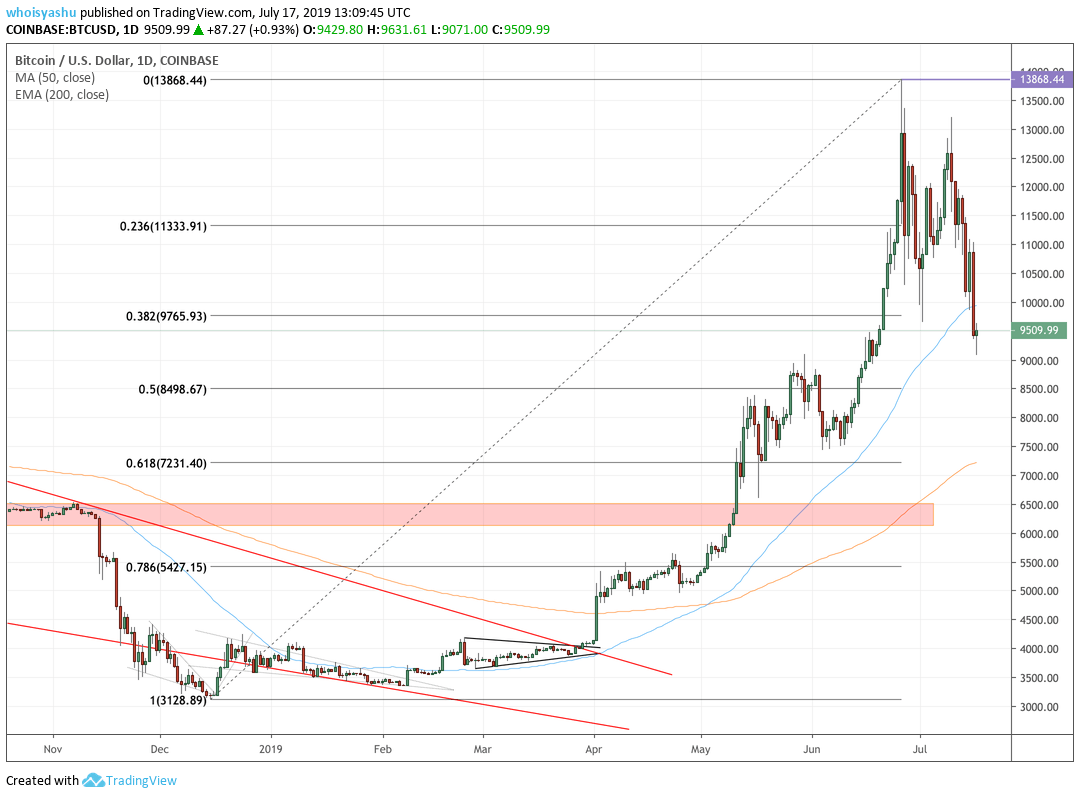
A Fibonacci wave, drawn from $3,128.89-low to $13,868-high, put the current bitcoin rate between the 38.2 percent and 50 percent retracement levels. As one can see, the price again tests the support levels discussed in the Bitcoin Futures section above. An extended downtrend brings bitcoin towards the 50 percent Fibonacci level, which coincides with the $8,498.67 level.
Meanwhile, a close below the 50 percent level brings the 61.8 percent retracement level in view, which coincides with the $7,231 level.
#3 Exponential Moving Average

The bitcoin price earlier broke below an interim moving average. It is now appearing to the test its 200-daily exponential moving average. The saffron curve in the chart above coincides with the $7,235.44 level. This downside target is similar to targets discussed in the Bitcoin Futures and Fibonacci Retracement sections above.
The technical indicators indicate that the area between $7,200 and $7,500 could serve as the next short target and potential support for the current downtrend.
Watch The Legend of Bitcoin
Click here for a real-time bitcoin price chart.
Disclaimer: The opinions expressed in this article are of the author and the author only. Cryptocurrency trading is risky. Kindly consider the article for educational purpose only.
